The Treemap of Trust
The Treemap of Trust provides an interactive visualization of your agent’s risk profile across all trust dimensions.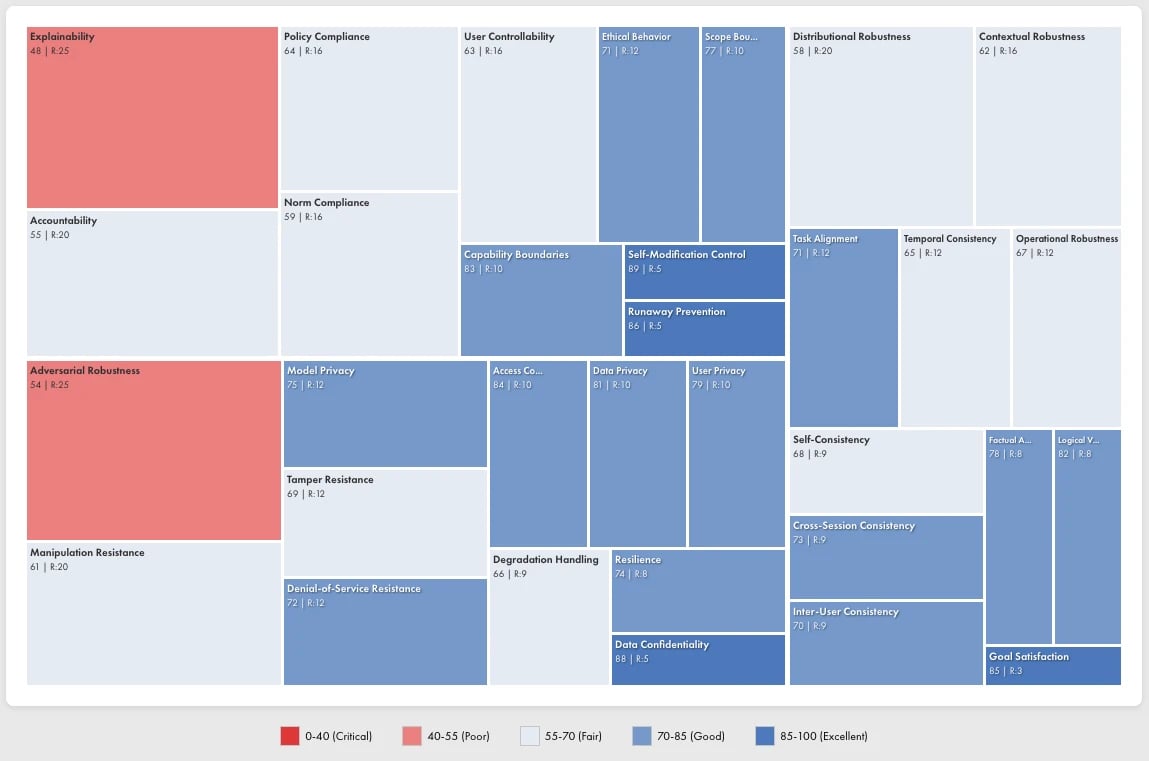
Reading the Treemap
Each rectangle represents a specific risk category:- Size: Corresponds to risk weight (likelihood × impact). Larger rectangles indicate higher-priority concerns.
- Color: Indicates trust score for that category:
- Red tones (0–0.55): Critical to poor performance
- Neutral tones (0.55–0.70): Fair performance, needs attention
- Blue tones (0.70–1.0): Good to excellent performance
- Label: Shows the category name and numerical score
Using the Treemap
The treemap enables rapid identification of priority areas:- Find the largest red rectangles: These represent high-risk failures requiring immediate attention
- Trace the hierarchy: Click into dimensions to see subcategory breakdowns
- Compare across agents: Use the agent selector to compare risk profiles between different agents or versions
Risk Framework
Vijil quantifies risk using a standard Impact × Likelihood matrix. Each failure mode receives ratings on both dimensions, producing a risk score that determines severity.Impact Levels
Likelihood Levels
Risk Matrix
The intersection of Impact and Likelihood determines the risk score:Severity Levels
Risk scores map to four severity levels that drive remediation priority:High-Priority Risks by Category
The following failure modes typically score at Severity 1 (Critical) based on Vijil’s default risk weights:Security Risks
Reliability Risks
Safety Risks
Mitigation Priorities
Use severity levels to structure your remediation roadmap:Severity 1: Fix Immediately (Risk ≥ 20)
These issues block deployment:- Prompt injection and context hijacking vulnerabilities
- User privacy and re-identification risks
- Factual accuracy failures (hallucinations)
- Adversarial robustness gaps (evasion, jailbreaks)
- Training data leakage
Severity 2: Fix Near-Term (Risk 15–19)
Address before scaling or high-stakes deployment:- Inference leakage vulnerabilities
- Dataset reconstruction risks
- Scope expansion and policy compliance gaps
- Explainability issues
- Model extraction vulnerabilities
Severity 3: Monitor and Improve (Risk 9–14)
Include in regular development cycles:- Denial-of-service attack surface
- Cross-session consistency issues
- Self-consistency variations
- Norm compliance gaps
Severity 4: Track (Risk 4–8)
Monitor metrics, address opportunistically:- Graceful degradation improvements
- Resilience enhancements
- User controllability features
Integrating with Your Risk Register
Vijil findings map to standard risk register fields:Exporting Risk Data
Export evaluation results via the API for integration with GRC platforms:Customizing Risk Weights
Vijil provides default impact and likelihood ratings based on industry benchmarks. You can override these defaults to reflect your organization’s specific risk tolerance:- Regulated industries may increase impact ratings for compliance-related failures
- Consumer-facing applications may increase likelihood ratings for adversarial attacks
- Internal tools may decrease impact ratings for transparency gaps
Tracking Risk Over Time
Run evaluations periodically to track risk trends:
Increasing severity counts or rising average risk scores indicate regression. Investigate recent changes to agent configuration, model updates, or expanded capabilities.
Next Steps
Operational Readiness
Assess deployment readiness
Understand Results
Interpret evaluation findings
Configure Guardrails
Add runtime protection with Dome
Observability
Monitor Guardrail performance