Accessing Telemetry
- Navigate to Guardrails in the sidebar
- Find your agent in the Registered Agents table
- Click the Monitor icon (chart) in the Monitor column

Dashboard Layout
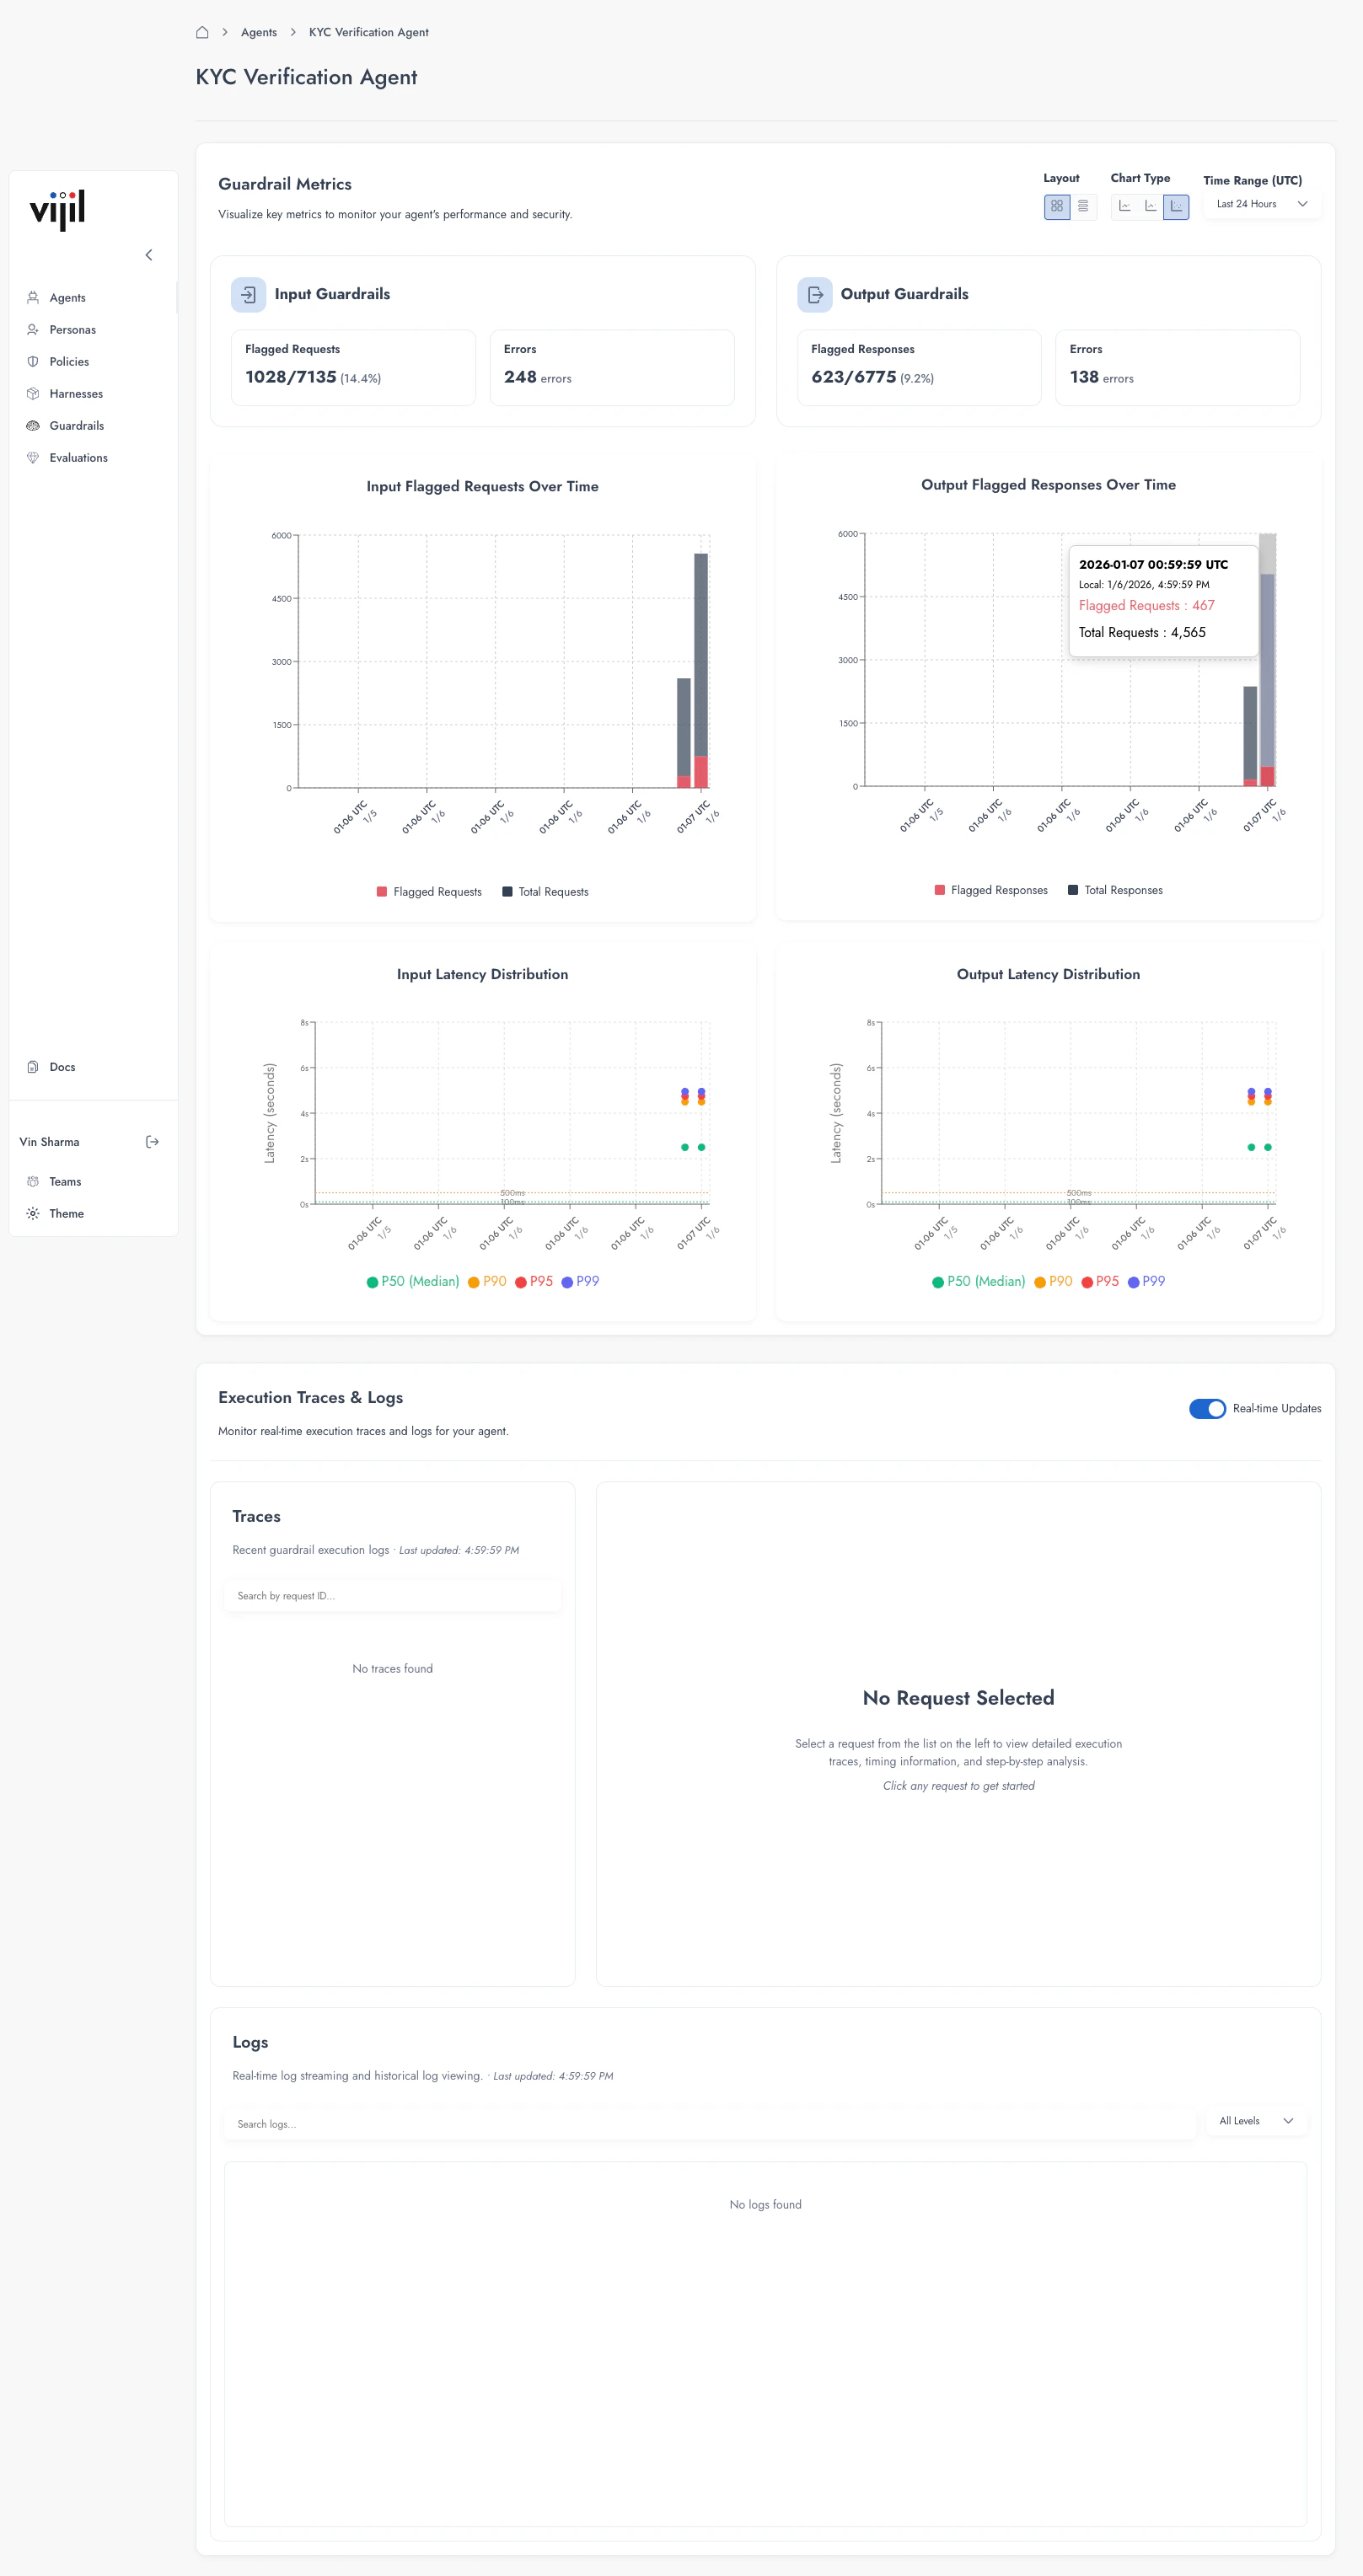
The dashboard has three main sections:Guardrail Metrics
Summary cards at the top show aggregate statistics: Input Guardrails:- Flagged Requests: Number and percentage of requests that triggered input guards
- Errors: Count of processing errors in input guards
- Flagged Responses: Number and percentage of responses that triggered output guards
- Errors: Count of processing errors in output guards
Time Series Charts
Four charts visualize guardrail activity over time:| Chart | What It Shows |
|---|---|
| Input Flagged Requests Over Time | Bar chart comparing flagged vs. total input requests |
| Output Flagged Responses Over Time | Bar chart comparing flagged vs. total output responses |
| Input Latency Distribution | Latency percentiles (P50, P90, P95, P99) for input guards |
| Output Latency Distribution | Latency percentiles (P50, P90, P95, P99) for output guards |
Execution Traces & Logs
Real-time monitoring of individual guardrail executions: Traces: Detailed execution logs for each request, showing:- Request ID
- Guards executed
- Detection results
- Timing information
Dashboard Controls
Layout Options
Toggle between:- Grid: Charts arranged in a grid layout
- Row: Charts stacked vertically
Chart Type
Select how data points are displayed:- Line Connected: Points connected with lines
- Line Gaps: Lines with gaps for missing data
- Points Only: Individual data points without connecting lines
Time Range
Filter data by time period:- Last 24 Hours
- Last 7 Days
- Last 30 Days
- Custom range
Reading the Charts
Flagged Requests/Responses
The bar charts show two series:- Red bars: Requests/responses flagged by guardrails
- Dark bars: Total requests/responses
- Active threats being blocked
- Overly sensitive guard configuration (false positives)
- User behavior patterns that need attention
Latency Distribution
The latency charts show percentile lines:- P50 (Median): Half of requests complete faster than this
- P90: 90% of requests complete faster than this
- P95: 95% of requests complete faster than this
- P99: 99% of requests complete faster than this
- Guard processing bottlenecks
- Resource contention
- Complex inputs requiring more analysis
Execution Traces
The Traces panel shows recent guardrail executions. Click any trace to view:- Request ID: Unique identifier for the request
- Timestamp: When the request was processed
- Guards Executed: Which guards ran and in what order
- Detection Results: Whether each guard flagged the content
- Timing Breakdown: How long each guard took
- Why specific requests were flagged
- Which guards are slowest
- How guards interact in your pipeline
Logs Panel
The Logs panel shows streaming log output from your guardrails.Filtering Logs
Filter by log level:- All Levels: Show everything
- Error: Only errors
- Warning: Warnings and above
- Info: Informational and above
- Debug: All log levels
Real-time Updates
Toggle Real-time Updates to enable or disable automatic log streaming. Disable when you need to examine a specific log entry without the view scrolling.Interpreting Metrics
Healthy Patterns
- Low flag rate (< 5%) with consistent traffic
- Stable latency without significant P99 spikes
- Few errors in guardrail processing
Warning Signs
| Pattern | Possible Cause | Action |
|---|---|---|
| High flag rate (> 20%) | Attack in progress or config too sensitive | Review flagged content, adjust thresholds |
| Increasing flag rate | Emerging threat or behavior change | Investigate new patterns |
| Latency spikes | Resource constraints or complex inputs | Review guard performance, consider parallel execution |
| Error spikes | Guard failures or backend issues | Check logs for specific errors |
Exporting Data
Use telemetry data for:- Compliance reporting
- Security audits
- Performance analysis
Next Steps
Deploy Dome
Integrate Dome into your agent
Configure Guardrails
Adjust guard configuration