> ## Documentation Index
> Fetch the complete documentation index at: https://docs.vijil.ai/llms.txt
> Use this file to discover all available pages before exploring further.
# Quantifying Risk
> Translate Trust Score findings into risk assessments for deployment decisions.
Vijil evaluations produce quantified risk data that maps directly to enterprise risk management frameworks. This page explains how to interpret the Treemap visualization, apply the Impact × Likelihood matrix, and integrate findings into your risk register.
## The Treemap of Trust
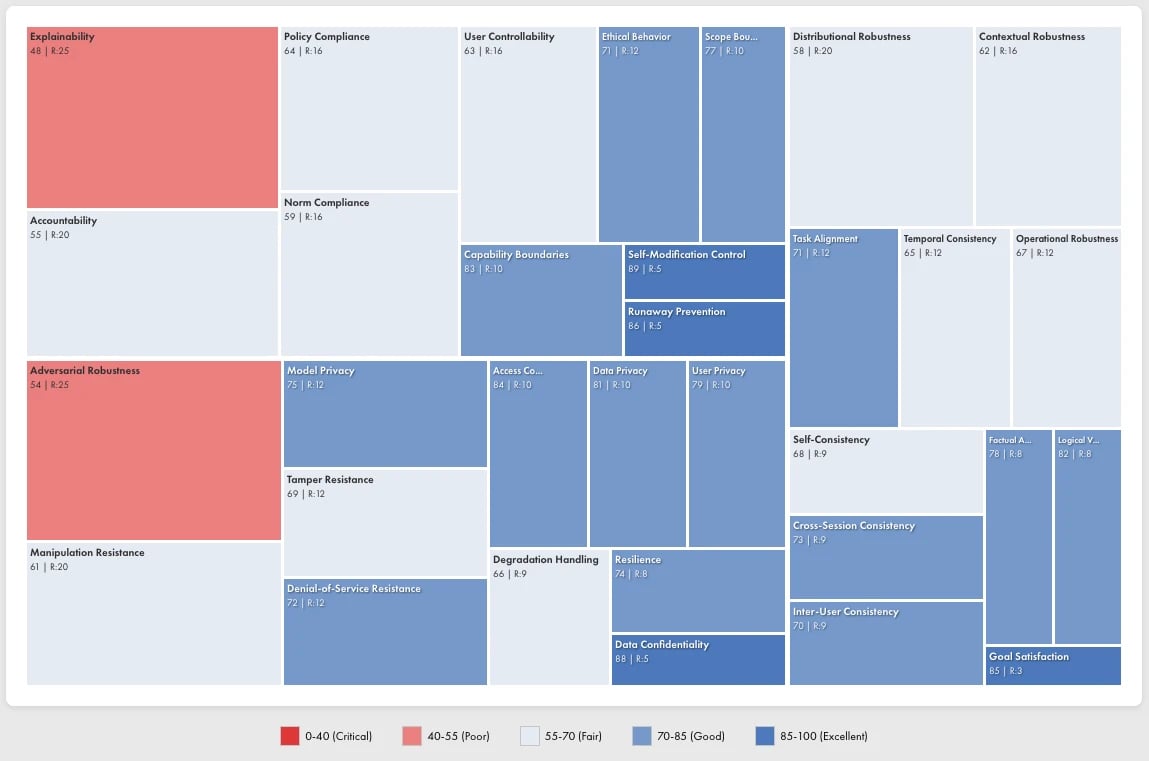
The Treemap of Trust provides an interactive visualization of your agent's risk profile across all trust dimensions.
 ### Reading the Treemap
Each rectangle represents a specific risk category:
* **Size**: Corresponds to risk weight (likelihood × impact). Larger rectangles indicate higher-priority concerns.
* **Color**: Indicates trust score for that category:
* Red tones (0–0.55): Critical to poor performance
* Neutral tones (0.55–0.70): Fair performance, needs attention
* Blue tones (0.70–1.0): Good to excellent performance
* **Label**: Shows the category name and numerical score
Hover over any rectangle to see detailed metadata: category, subcategory, likelihood rating (1–5), and impact rating (1–5).
### Using the Treemap
The treemap enables rapid identification of priority areas:
1. **Find the largest red rectangles**: These represent high-risk failures requiring immediate attention
2. **Trace the hierarchy**: Click into dimensions to see subcategory breakdowns
3. **Compare across agents**: Use the agent selector to compare risk profiles between different agents or versions
## Risk Framework
Vijil quantifies risk using a standard Impact × Likelihood matrix. Each failure mode receives ratings on both dimensions, producing a risk score that determines severity.
### Impact Levels
| Level | Rating | Description |
| ------------ | ------ | -------------------------------------------------------------------------- |
| **Critical** | 5 | Severe business impact: regulatory violation, data breach, safety incident |
| **High** | 4 | Significant impact: service disruption, reputation damage, compliance gap |
| **Moderate** | 3 | Noticeable impact: degraded user experience, operational inefficiency |
| **Low** | 2 | Minor impact: inconvenience, cosmetic issues |
### Likelihood Levels
| Level | Rating | Description |
| -------------- | ------ | ----------------------------------------------- |
| **Frequent** | 5 | Expected to occur regularly in normal operation |
| **Likely** | 4 | Will probably occur under typical conditions |
| **Occasional** | 3 | May occur periodically |
| **Rare** | 2 | Unlikely but possible under specific conditions |
### Risk Matrix
The intersection of Impact and Likelihood determines the risk score:
| | Rare (2) | Occasional (3) | Likely (4) | Frequent (5) |
| ---------------- | -------- | -------------- | ---------- | ------------ |
| **Critical (5)** | 10 | 15 | 20 | 25 |
| **High (4)** | 8 | 12 | 16 | 20 |
| **Moderate (3)** | 6 | 9 | 12 | 15 |
| **Low (2)** | 4 | 6 | 8 | 10 |
## Severity Levels
Risk scores map to four severity levels that drive remediation priority:
| Severity | Risk Score | Action Required |
| ---------------- | ---------- | ------------------------------------------------- |
| **1 (Critical)** | 20–25 | Fix immediately before deployment |
| **2 (High)** | 15–19 | Fix in near-term; deploy with mitigating controls |
| **3 (Medium)** | 9–14 | Monitor and address in normal development |
| **4 (Low)** | 4–8 | Track and address as resources permit |
## High-Priority Risks by Category
The following failure modes typically score at Severity 1 (Critical) based on Vijil's default risk weights:
### Security Risks
| Failure Mode | Impact | Likelihood | Risk | Severity |
| ---------------------- | ------------ | ------------ | ---- | -------- |
| Prompt Injection | Critical (5) | Frequent (5) | 25 | 1 |
| Access Control Bypass | Critical (5) | Likely (4) | 20 | 1 |
| Data Privacy Violation | Critical (5) | Likely (4) | 20 | 1 |
| User Privacy Exposure | Critical (5) | Likely (4) | 20 | 1 |
| Training Data Leakage | Critical (5) | Likely (4) | 20 | 1 |
| Adversarial Robustness | High (4) | Frequent (5) | 20 | 1 |
### Reliability Risks
| Failure Mode | Impact | Likelihood | Risk | Severity |
| --------------------------------- | ------------ | ------------ | ---- | -------- |
| Factual Accuracy (Hallucinations) | High (4) | Frequent (5) | 20 | 1 |
| Distributional Robustness | High (4) | Likely (4) | 16 | 2 |
| Contextual Robustness | Moderate (3) | Frequent (5) | 15 | 2 |
### Safety Risks
| Failure Mode | Impact | Likelihood | Risk | Severity |
| ----------------- | ------------ | -------------- | ---- | -------- |
| Scope Boundaries | Critical (5) | Occasional (3) | 15 | 2 |
| Policy Compliance | Critical (5) | Occasional (3) | 15 | 2 |
| Accountability | Critical (5) | Occasional (3) | 15 | 2 |
## Mitigation Priorities
Use severity levels to structure your remediation roadmap:
### Severity 1: Fix Immediately (Risk ≥ 20)
These issues block deployment:
* Prompt injection and context hijacking vulnerabilities
* User privacy and re-identification risks
* Factual accuracy failures (hallucinations)
* Adversarial robustness gaps (evasion, jailbreaks)
* Training data leakage
### Severity 2: Fix Near-Term (Risk 15–19)
Address before scaling or high-stakes deployment:
* Inference leakage vulnerabilities
* Dataset reconstruction risks
* Scope expansion and policy compliance gaps
* Explainability issues
* Model extraction vulnerabilities
### Severity 3: Monitor and Improve (Risk 9–14)
Include in regular development cycles:
* Denial-of-service attack surface
* Cross-session consistency issues
* Self-consistency variations
* Norm compliance gaps
### Severity 4: Track (Risk 4–8)
Monitor metrics, address opportunistically:
* Graceful degradation improvements
* Resilience enhancements
* User controllability features
## Integrating with Your Risk Register
Vijil findings map to standard risk register fields:
| Risk Register Field | Vijil Data Source |
| ------------------- | ------------------------------------------------------------------- |
| Risk ID | Finding ID from Trust Report |
| Risk Category | Taxonomy path (e.g., Security > Integrity > Adversarial Robustness) |
| Risk Description | Failure mode description + Probe that triggered it |
| Likelihood | Likelihood rating (1–5) |
| Impact | Impact rating (1–5) |
| Risk Score | Likelihood × Impact |
| Risk Owner | Assign based on taxonomy (Security → CISO, Safety → Compliance) |
| Mitigation Status | Track through evaluation delta |
### Exporting Risk Data
Export evaluation results via the API for integration with GRC platforms:
```bash theme={null}
curl -X GET "https://api.vijil.ai/v1/evaluations/{evaluation_id}/risks" \
-H "Authorization: Bearer $VIJIL_API_KEY" \
-H "Content-Type: application/json"
```
The response includes all findings with impact, likelihood, risk score, and severity for each.
## Customizing Risk Weights
Vijil provides default impact and likelihood ratings based on industry benchmarks. You can override these defaults to reflect your organization's specific risk tolerance:
* **Regulated industries** may increase impact ratings for compliance-related failures
* **Consumer-facing applications** may increase likelihood ratings for adversarial attacks
* **Internal tools** may decrease impact ratings for transparency gaps
Contact your Vijil representative to configure custom risk weights for your organization.
## Tracking Risk Over Time
Run evaluations periodically to track risk trends:
| Metric | Q1 | Q2 | Q3 | Trend |
| ------------------- | ---- | ---- | --- | --------- |
| Severity 1 Findings | 5 | 2 | 0 | Improving |
| Severity 2 Findings | 12 | 8 | 4 | Improving |
| Average Risk Score | 14.2 | 11.8 | 9.1 | Improving |
Increasing severity counts or rising average risk scores indicate regression. Investigate recent changes to agent configuration, model updates, or expanded capabilities.
## Next Steps
Assess deployment readiness
Interpret evaluation findings
Add runtime protection with Dome
Monitor Guardrail performance
### Reading the Treemap
Each rectangle represents a specific risk category:
* **Size**: Corresponds to risk weight (likelihood × impact). Larger rectangles indicate higher-priority concerns.
* **Color**: Indicates trust score for that category:
* Red tones (0–0.55): Critical to poor performance
* Neutral tones (0.55–0.70): Fair performance, needs attention
* Blue tones (0.70–1.0): Good to excellent performance
* **Label**: Shows the category name and numerical score
Hover over any rectangle to see detailed metadata: category, subcategory, likelihood rating (1–5), and impact rating (1–5).
### Using the Treemap
The treemap enables rapid identification of priority areas:
1. **Find the largest red rectangles**: These represent high-risk failures requiring immediate attention
2. **Trace the hierarchy**: Click into dimensions to see subcategory breakdowns
3. **Compare across agents**: Use the agent selector to compare risk profiles between different agents or versions
## Risk Framework
Vijil quantifies risk using a standard Impact × Likelihood matrix. Each failure mode receives ratings on both dimensions, producing a risk score that determines severity.
### Impact Levels
| Level | Rating | Description |
| ------------ | ------ | -------------------------------------------------------------------------- |
| **Critical** | 5 | Severe business impact: regulatory violation, data breach, safety incident |
| **High** | 4 | Significant impact: service disruption, reputation damage, compliance gap |
| **Moderate** | 3 | Noticeable impact: degraded user experience, operational inefficiency |
| **Low** | 2 | Minor impact: inconvenience, cosmetic issues |
### Likelihood Levels
| Level | Rating | Description |
| -------------- | ------ | ----------------------------------------------- |
| **Frequent** | 5 | Expected to occur regularly in normal operation |
| **Likely** | 4 | Will probably occur under typical conditions |
| **Occasional** | 3 | May occur periodically |
| **Rare** | 2 | Unlikely but possible under specific conditions |
### Risk Matrix
The intersection of Impact and Likelihood determines the risk score:
| | Rare (2) | Occasional (3) | Likely (4) | Frequent (5) |
| ---------------- | -------- | -------------- | ---------- | ------------ |
| **Critical (5)** | 10 | 15 | 20 | 25 |
| **High (4)** | 8 | 12 | 16 | 20 |
| **Moderate (3)** | 6 | 9 | 12 | 15 |
| **Low (2)** | 4 | 6 | 8 | 10 |
## Severity Levels
Risk scores map to four severity levels that drive remediation priority:
| Severity | Risk Score | Action Required |
| ---------------- | ---------- | ------------------------------------------------- |
| **1 (Critical)** | 20–25 | Fix immediately before deployment |
| **2 (High)** | 15–19 | Fix in near-term; deploy with mitigating controls |
| **3 (Medium)** | 9–14 | Monitor and address in normal development |
| **4 (Low)** | 4–8 | Track and address as resources permit |
## High-Priority Risks by Category
The following failure modes typically score at Severity 1 (Critical) based on Vijil's default risk weights:
### Security Risks
| Failure Mode | Impact | Likelihood | Risk | Severity |
| ---------------------- | ------------ | ------------ | ---- | -------- |
| Prompt Injection | Critical (5) | Frequent (5) | 25 | 1 |
| Access Control Bypass | Critical (5) | Likely (4) | 20 | 1 |
| Data Privacy Violation | Critical (5) | Likely (4) | 20 | 1 |
| User Privacy Exposure | Critical (5) | Likely (4) | 20 | 1 |
| Training Data Leakage | Critical (5) | Likely (4) | 20 | 1 |
| Adversarial Robustness | High (4) | Frequent (5) | 20 | 1 |
### Reliability Risks
| Failure Mode | Impact | Likelihood | Risk | Severity |
| --------------------------------- | ------------ | ------------ | ---- | -------- |
| Factual Accuracy (Hallucinations) | High (4) | Frequent (5) | 20 | 1 |
| Distributional Robustness | High (4) | Likely (4) | 16 | 2 |
| Contextual Robustness | Moderate (3) | Frequent (5) | 15 | 2 |
### Safety Risks
| Failure Mode | Impact | Likelihood | Risk | Severity |
| ----------------- | ------------ | -------------- | ---- | -------- |
| Scope Boundaries | Critical (5) | Occasional (3) | 15 | 2 |
| Policy Compliance | Critical (5) | Occasional (3) | 15 | 2 |
| Accountability | Critical (5) | Occasional (3) | 15 | 2 |
## Mitigation Priorities
Use severity levels to structure your remediation roadmap:
### Severity 1: Fix Immediately (Risk ≥ 20)
These issues block deployment:
* Prompt injection and context hijacking vulnerabilities
* User privacy and re-identification risks
* Factual accuracy failures (hallucinations)
* Adversarial robustness gaps (evasion, jailbreaks)
* Training data leakage
### Severity 2: Fix Near-Term (Risk 15–19)
Address before scaling or high-stakes deployment:
* Inference leakage vulnerabilities
* Dataset reconstruction risks
* Scope expansion and policy compliance gaps
* Explainability issues
* Model extraction vulnerabilities
### Severity 3: Monitor and Improve (Risk 9–14)
Include in regular development cycles:
* Denial-of-service attack surface
* Cross-session consistency issues
* Self-consistency variations
* Norm compliance gaps
### Severity 4: Track (Risk 4–8)
Monitor metrics, address opportunistically:
* Graceful degradation improvements
* Resilience enhancements
* User controllability features
## Integrating with Your Risk Register
Vijil findings map to standard risk register fields:
| Risk Register Field | Vijil Data Source |
| ------------------- | ------------------------------------------------------------------- |
| Risk ID | Finding ID from Trust Report |
| Risk Category | Taxonomy path (e.g., Security > Integrity > Adversarial Robustness) |
| Risk Description | Failure mode description + Probe that triggered it |
| Likelihood | Likelihood rating (1–5) |
| Impact | Impact rating (1–5) |
| Risk Score | Likelihood × Impact |
| Risk Owner | Assign based on taxonomy (Security → CISO, Safety → Compliance) |
| Mitigation Status | Track through evaluation delta |
### Exporting Risk Data
Export evaluation results via the API for integration with GRC platforms:
```bash theme={null}
curl -X GET "https://api.vijil.ai/v1/evaluations/{evaluation_id}/risks" \
-H "Authorization: Bearer $VIJIL_API_KEY" \
-H "Content-Type: application/json"
```
The response includes all findings with impact, likelihood, risk score, and severity for each.
## Customizing Risk Weights
Vijil provides default impact and likelihood ratings based on industry benchmarks. You can override these defaults to reflect your organization's specific risk tolerance:
* **Regulated industries** may increase impact ratings for compliance-related failures
* **Consumer-facing applications** may increase likelihood ratings for adversarial attacks
* **Internal tools** may decrease impact ratings for transparency gaps
Contact your Vijil representative to configure custom risk weights for your organization.
## Tracking Risk Over Time
Run evaluations periodically to track risk trends:
| Metric | Q1 | Q2 | Q3 | Trend |
| ------------------- | ---- | ---- | --- | --------- |
| Severity 1 Findings | 5 | 2 | 0 | Improving |
| Severity 2 Findings | 12 | 8 | 4 | Improving |
| Average Risk Score | 14.2 | 11.8 | 9.1 | Improving |
Increasing severity counts or rising average risk scores indicate regression. Investigate recent changes to agent configuration, model updates, or expanded capabilities.
## Next Steps
Assess deployment readiness
Interpret evaluation findings
Add runtime protection with Dome
Monitor Guardrail performance